Problem:
Current vs Voltage (IV) and Capacitance vs Voltage (CV) data can be very helpful in determining key properties in source charge based devices such as Schottky diodes, PN diodes, and Metal-Oxide-Semiconductor (MOS) capacitors. Upon completion of a fabrication run an upward of 10 patterned samples with >140 diodes each could be yielded thus the task of measuring, analyzing and then visualizing the data became increasingly arduous especially when attempting to execute complex fitting to multiple data sets.
Solution:
After some deliberation it was decided that a program which could import and visualize data easily should be made and that coding should be done in an environment which could easily be modified by other engineers. I chose LabVIEW as the coding environment due to its ease of use and ability to easily interface with other programs. As a frame of reference, I could normally extract, analyze and plot around 20 sets of measurements in around 2hrs assuming I knew exactly how the data needed to be presented. With the program I can accomplish the same tasks on 144 sets of measurements in <10min.
Our group regularly fabricates schottky diodes, PN diodes, and TLM structures and characterizes them using a mixture of voltage, current, capacitance, and temperature. Since many types of devices can be characterized with so many techniques the analysis program requires careful thought so that it can be as robust as possible without producing erroneous results. Currently the analysis capabilities include:
- Current-Voltage Visualization
- Multi-Diode Levenberg-Marquardt Automatic Fitting
- Specific-On Resistance Calculations
- Variable Temperature Reverse Bias Analysis
- Variable Temperature Werner-Gutler Analysis
- Capacitance-Voltage Visualization
- A²/C², Doping, and Depletion Width Dependence Visualization
- Linear A²/C² Automatic Fitting
- TLM Current-Voltage Visualization
- Linear I-V Automatic Fitting
- Circular (Corrected or Uncorrected) TLM Fitting
- Linear TLM Fitting
- More Coming
I-V Data Analysis

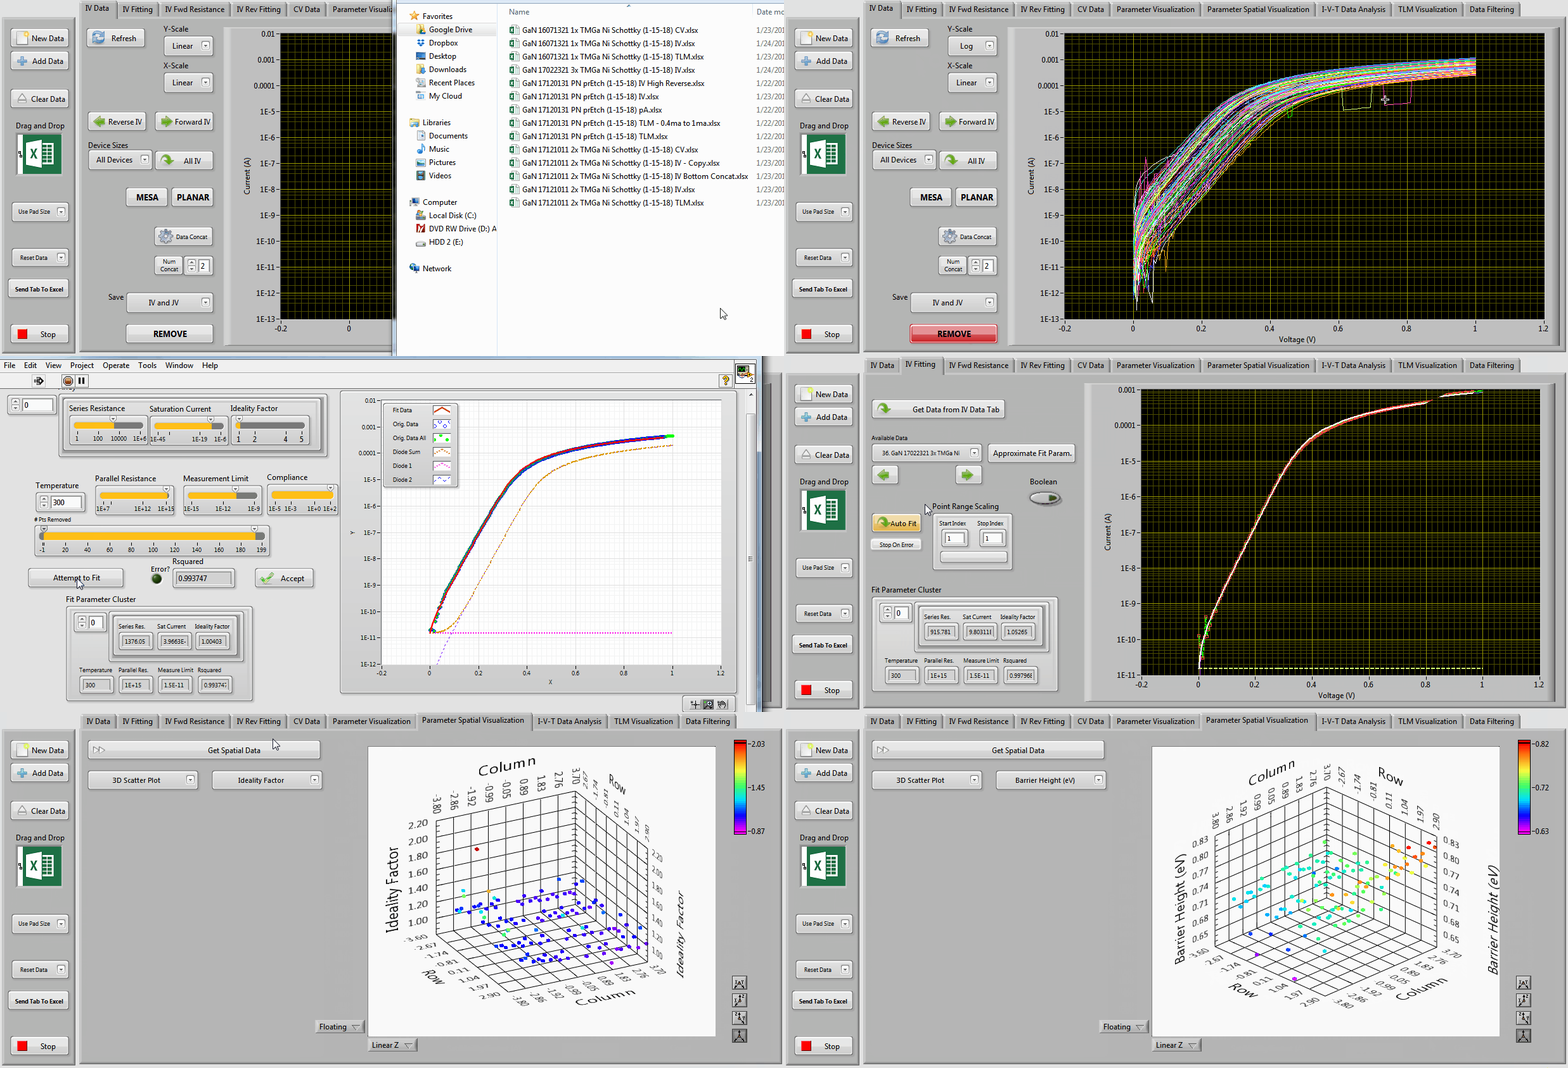
I-V Data is imported from an Excel file, visualized and then spurious data is removed. Next, parameters for the series resistance, saturation current, and ideality factor are chosen as initial conditions for the fitting procedure. The curve is fit and the extracted parameters are used to help automatically fit the other 100+ curves. Finally, the extracted parameters are visualized in comparison to each other and spatially.
C-V Data Analysis

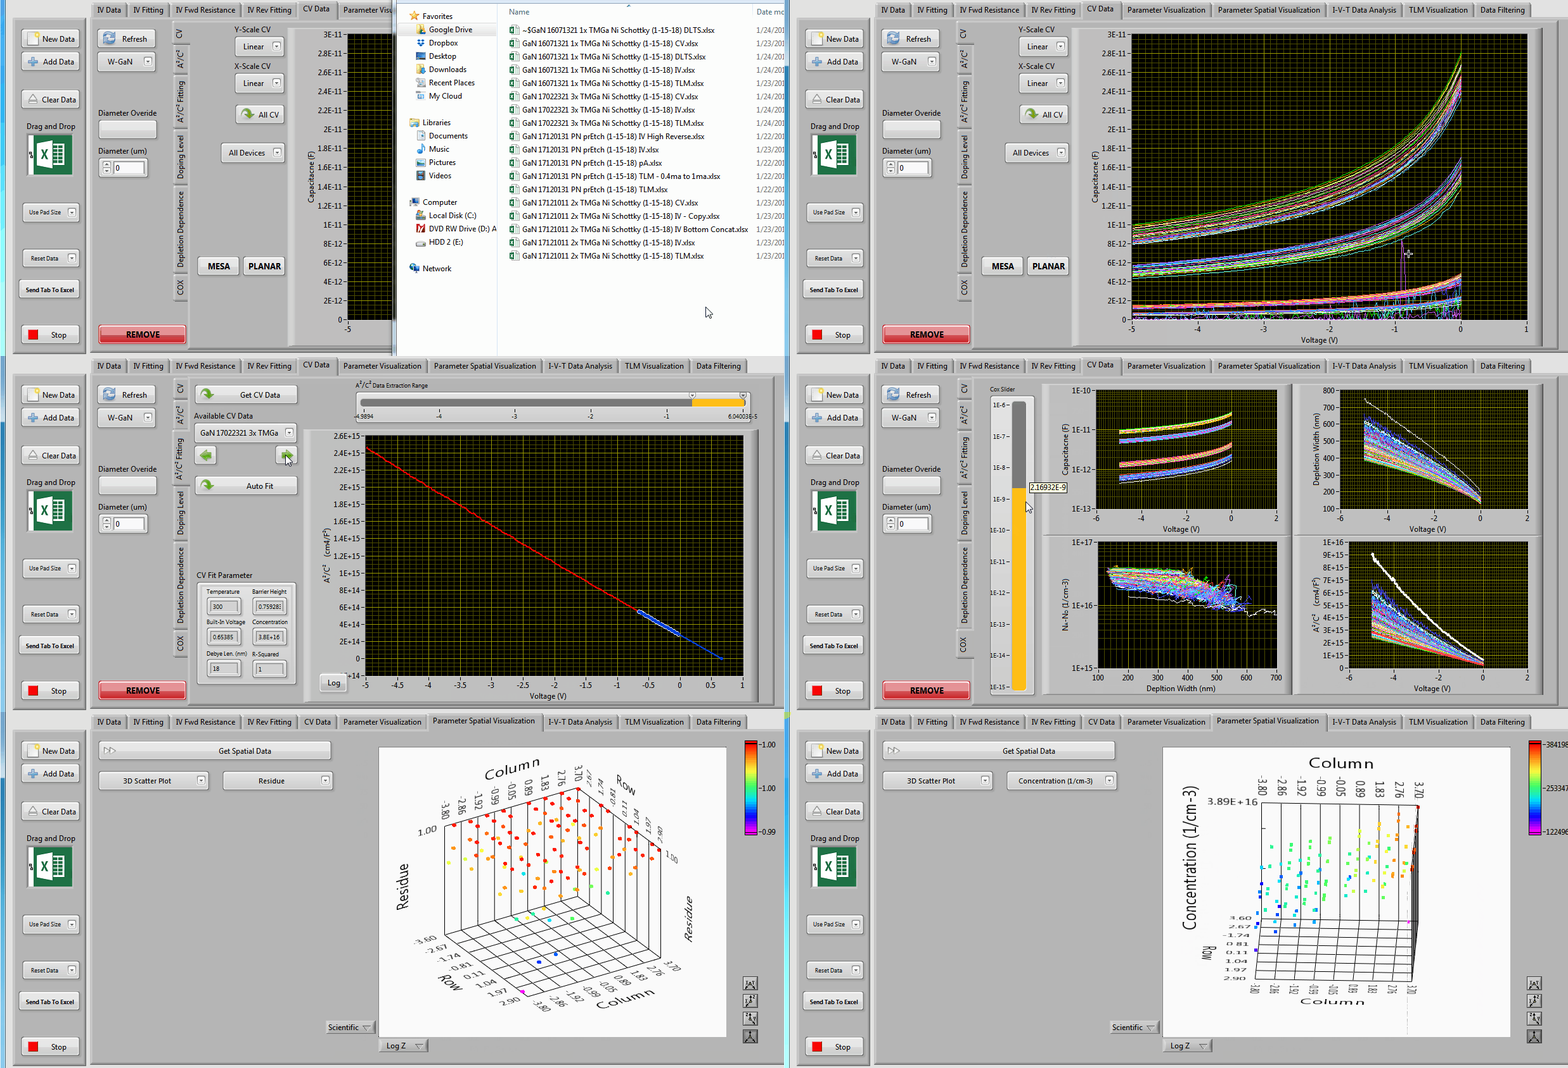
C-V Data is imported from an Excel file, spurious data is removed, and the various forms of the data is visualized (capacitance, concentration and depletion width dependences). Next, values for the built-in voltage, barrier height, and free carrier concentration are automatically extracted from 100+ curves. Finally, the extracted values are visualized.
Data Loading into Excel
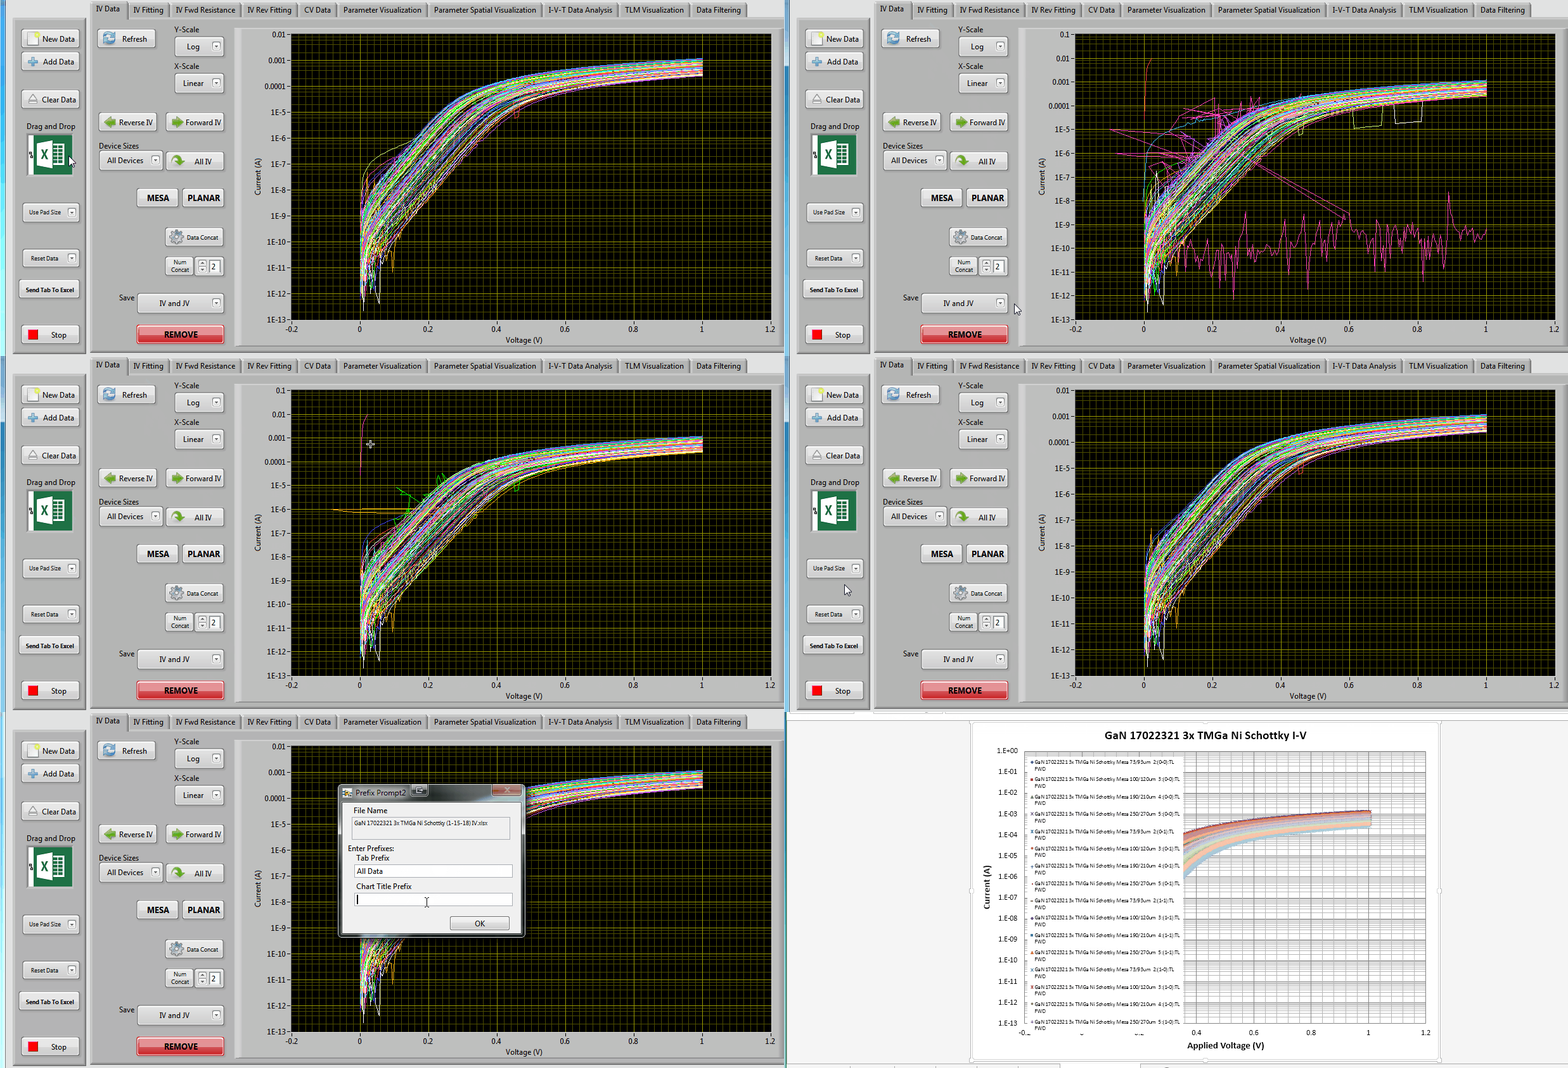
I quickly found that, although the data could be analyzed very quickly, it would be near useless unless I could present it to my advisor and colleagues in a manner that could be easily interpreted and understood. Luckily, LabVIEW has ActiveX controls to load and manipulate data into Excel.

